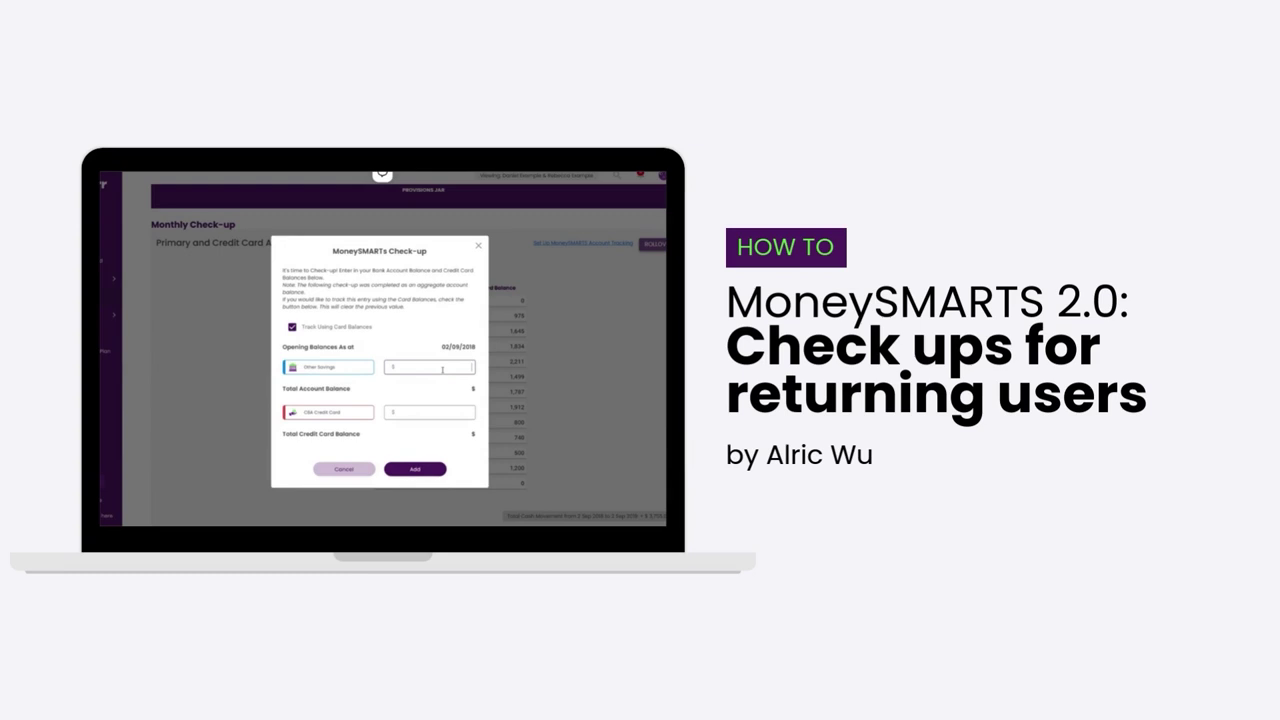
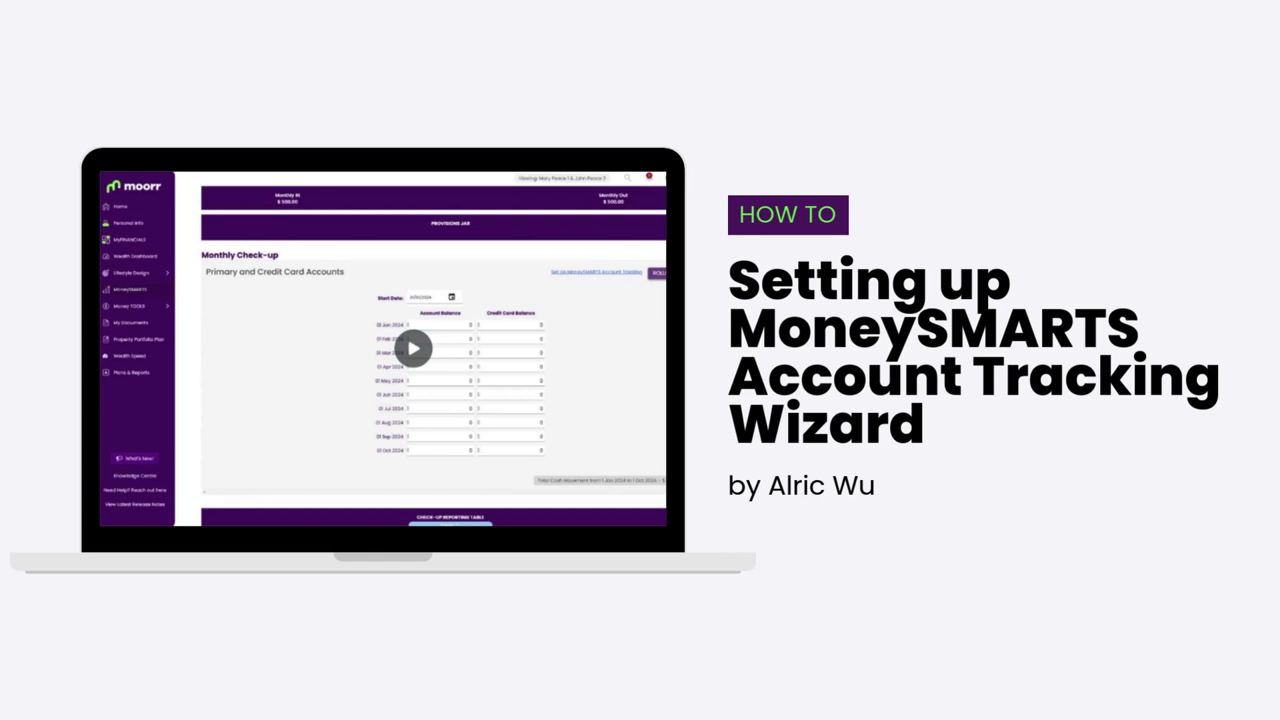
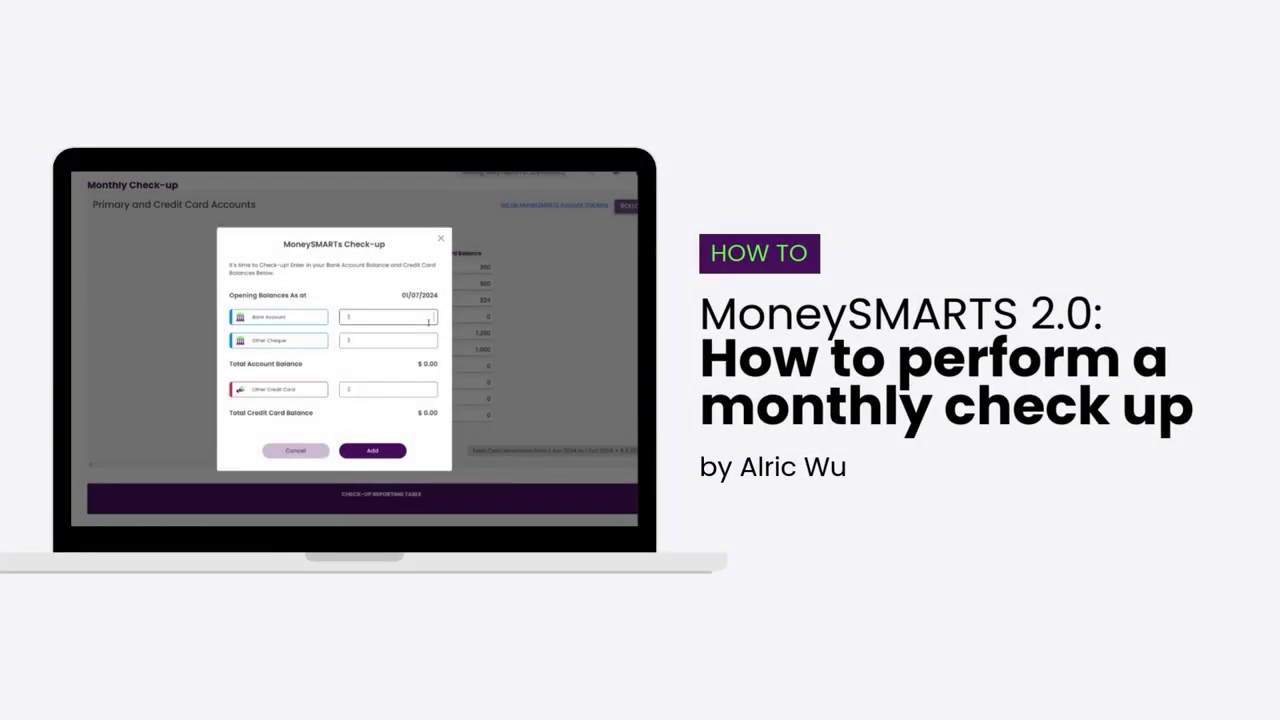
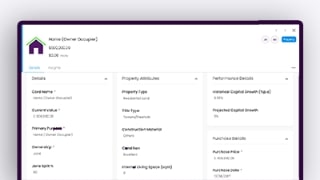
Here’s a demo video showcasing the Historical Tracking feature on Moorr!
In the video below, we’ll guide you through the exact steps to fully utilise this feature. Explore the revolutionary Historical Changelog feature, ‘As at dates,’ and card insights that empower you to track your financial performance over time today!
Transcript:
Hi, I’m Alric, a Product Manager here at Moorr. Today, I’ll be taking you through the number one most requested feature by our users on the Moorr platform.
This new update introduces the ability for you to track your financial performance historically. As part of this massive update, I’ll be taking you through a brief overview of the included features, including the Historical Changelog, “As at dates,” and card insights.
Historical tracking and the Historical Changelog is essentially an area of space for you to start tracking the history of your financial information. From what you can see on the screen over here in MyFINANCIALS, we’ve got the current value of this particular property. Within this particular property, we were able to see the current value as well as by clicking on the access historical changelog button, a reverse chronological order view of the historical values associated with this particular field. So you can see from this particular screen over here that 26 Anywhere Street has a current value of $650,000, and the last time this particular field was updated was on the 31st of March 2023. From there, you can also see the previous values that were loaded into this particular field for this particular property.
So as you come back over to here, if we wanted to change the value of this particular property on the fly, we can still do that from this particular space here using the inline edit feature.
What you’ll see here is there’s a quick reference to as at 31st of March 2023. This refers to the last time this particular field was updated and henceforth is known as the current position for that particular field. If I wanted to change this now, say to reflect the new position, you’ll see that the “as that date” over here automatically updates to today’s date. I can, of course, change this if I wanted to, to reflect it for a prior date. So let’s say, for example, this is actually the value as of the 19th of December when I go to valuation done as an example and it will save automatically.
Once that’s saved, you can see through the historical changelog over here that I do have that new value listed as part of the history. I can also go through to the historical changelog again by clicking on the Access historical changelog button on the field and adding a new value in via this particular UI as well.
Now this particular section is ordered by reverse chronological order and it’ll automatically add in new entries to the respective positions. So let’s say, for example, I wanted to add in a value in 2018, in between these two dates. I can simply enter in the value and you’ll see that it automatically adds in into the particular order.
Now this will be great if you have past Excel spreadsheets or past records of data that you want to enter in with regards to this particular asset.
So why would you want to store your financial data historically?
Well, one of the key number one requests that we had from our users was to be able to track the financial performance of their household historically.
You’ll now be able to do this with the data that you have in the platform, for example, by clicking on the insights tab, which is a new tab under your card, and you’ll be able to see the performance history of that particular property as an example. They’ll also be able to see the breakdown of that particular property in your entire asset portfolio.
And of course, we’ll also be introducing a lot more insights with respect to your overall financial performance in the near future.
As time goes on, you’ll find that your financial position changes. When doing so, you’ll likely be archiving a number of income cards, expense cards, asset cards, or borrowing cards. The beauty of the historical change log is that you’re now able to see the history and maintain the history of these previous cards, even though they no longer relate to your current position.
Let’s take, for instance, this property card over here. You got a value of $500,000 right prior to this card being archived and let’s say the property was sold as an example, which is why we would want to do the archiving in the first place. You can still go back and see the history of that particular piece of information.
Again, this card will retain its own card insights and you can still track the performance and the history of it up until the point in time that it was archived.
In the future, we’ll be introducing a lot more dashboards, insights, graphs and charts all around your property and your financial performance to enable you to better utilise, visualise and analyse your financial performance on the platform.
We hope you find this demo video helpful. If you’d like to learn more about this feature, check out the Historical Tracking Release Notes Here >
👉 Discover exclusive insights and strategies with Moorr! Available on Android or iOS to access MoneySMARTS and Residential Property Insights.
